The estimated combined population for the Lower Mekong countries was 242.8 million in 2018.1 Vietnam had the largest population at 96.5 million, while Laos had the smallest at 7 million.
The Lower Mekong countries had an average annual population growth rate of 1.12 percent in the period 2010–2016. Thailand was the lowest at 0.4 percent, followed by Myanmar on 0.8 percent, Vietnam 1.1 percent, Cambodia 1.6 percent and Laos 1.7 percent.2 Thailand’s lower birth rate is attributed to better information on family planning, but also reflects an international trend toward slowed population growth associated with improved economic status.3 According to UN projections, Thailand will be the only country in the Lower Mekong to drop into negative population growth (-0.11 percent) by 2025–2030.4
Age distribution
The populations of the Lower Mekong countries are young. An average of one in five are 0–14 years old, with the highest proportions in Laos (34 percent) and Cambodia (31 percent), while just 17 percent are in this age group in Thailand.5
Not surprisingly, this young population is increasingly connected to the world. Internet penetration in the region is rising rapidly, particularly as smartphones with low-cost internet plans become more widely available.6
Looking at average life expectancy at birth forecasts for 2015–2020, Lower Mekong countries split into two groups: Vietnam (76.5 years) and Thailand (75 years) are significantly ahead of Cambodia (70 years), Laos (67.5) and Myanmar (66.5 years).7 The longest life expectancy in the Lower Mekong is held by Vietnamese women, who can expect to live to 81 – just one year less than women in the United States of America.
The growth in life expectancy figures in recent years also has a wide spread – in just the period 2000–2015, Cambodia saw a jump of 10 years and Laos almost 8 years, while Myanmar and Thailand gained an additional 4 years and Vietnam 2.5 years.8
Population density
As a region, the Lower Mekong countries had an average population density of 125 people/km2 in 2015, a little less than China (146 people/km2), but much less than India (441 people/km2).9 This average, however, hides Vietnam’s high population density of 296 people/km2. Laos has the lowest population density in the region with only 29 people/km2 . Thailand is closest to the region average with a population density of 133 people/km2.
Source: United Nations, Population Division. World Population Prospects: The 2015 Revision. Population density by major area, region and country, 1950-2100 (persons per square km). Created by ODM, April 2016, reviewed March 2019. Licensed under CC BY-SA 4.0.
Even so, Vietnam’s population is focused in two areas: the Red River Delta, including greater Hanoi, and the Mekong Delta, including greater Ho Chi Minh City. Unlike other parts of ASEAN, and with the exception of Thailand, growth is projected to continue through 2050. This will increase density and may strain resources, contribute to urban-rural migration, and create greater demand for efficient and sustainable development practices.
Migration
Current migration patterns are shaped by the pull of employment opportunities. By 2006 unskilled labor was being drawn from Cambodia, Lao PDR and Myanmar into Thailand, while Lao PDR and Cambodia saw an influx of higher skilled laborers from Vietnam.10 High skilled labor, sourced from China’s Yunnan and Guangxi provinces, was flowing into neighboring Lao PDR and Myanmar; with significant Chinese migration also reported in Cambodia. Education, vocational training and eventually increased mobility of labor associated with the ASEAN Economic Community (AEC)11—as well as economic growth differentials across the Mekong region—will shape migration patterns in the coming years.
Migration within countries is also increasingly common. To some extent, this is related to development trends, which sometimes displace people due to land transfers12 and economic stresses, as well as to increased urbanization.
As the Asia Development Bank has noted, rural-to-urban migration is common in developing countries (where an emerging city-based middle class creates consumer demand that will employ migrants).13 The Lower Mekong countries reflect this dynamic with an average urban population growth rate of 2.6 percent in 2017,14 ranging from 1.7 percent in Myanmar to 3.3 percent in Cambodia and Laos. There is a corresponding decline in the percentage of the population employed in agricultural production.
Cambodia has by far the highest rural population (79.2 percent of the total population in 2015) and Thailand the lowest (49.6 percent).15 The other three Lower Mekong countries have a similar rural/urban split, with Vietnam’s rural population 66.4 percent of the total, Myanmar 65.9 percent and Laos 61.3 percent.
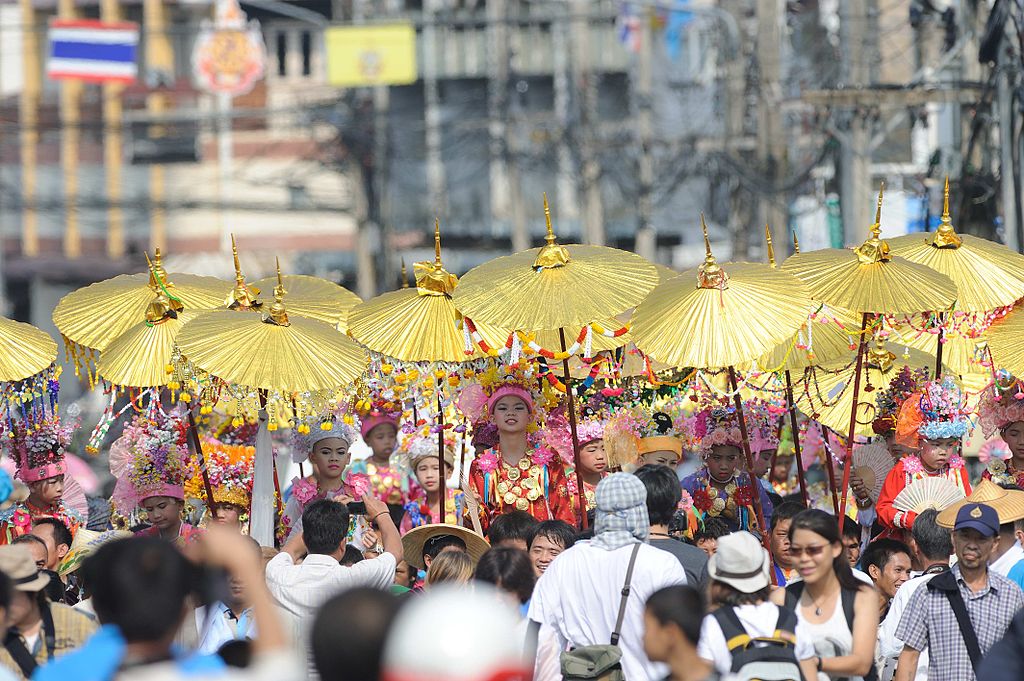
Poi Sang Long Festival being celebrated by a Shan community in Thailand. Photo by Niwat Tantayanusorn via WikiMedia Commons. Licensed under CC BY-SA 4.0.
Diversity
The region’s earliest inhabitants were mostly from the Mon-Khmer language family. Later influxes of people from southern China who spoke languages from the Tai (including Thai and Lao), Indian and Burmese linguistic groups16 added to the region’s diversity and linguistic divergences.
There are as many as 150 distinct ethnic and indigenous groups across the region. Myanmar and Laos are among the most diverse countries in the world, with a high percentage of indigenous groups, collectively comprising 35–70 percent of the populations.
While the other three Lower Mekong countries are more homogenous, they also have significant populations of ethnic minorities and indigenous people. Among these are persons descended from Chinese merchants—who, especially during the colonial period, played a key role in commerce17—or from various national ethnic groups found in neighboring countries for similar reasons, or due to historic changes in boundaries. Among these are significant populations of ethnic Khmer in southern Vietnam and ethnic Vietnamese in Cambodia and Laos.
Another example of minorities are those who hold religious beliefs differing from the majority in their society, such as Islam or Christianity. Buddhism is the majority-held religious credo in four of the five countries, while in Vietnam it represented the largest faction at 45.3 percent.18 Theravada Buddhism dominates all countries except Vietnam, where Mahayana Buddhism is dominant.
Censuses
With the exception of Myanmar, all Lower Mekong countries conduct a population and housing census every ten years. Before Myanmar’s 2014 census, released in 2015, the last official census was in 1983. Laos undertook its most recent population and housing census in June 2014. Cambodia’s most recent census occurred between March 3 – 13, 2019. Other specialized surveys and censuses of population, economic and agricultural activities are also conducted by some countries.
Related to population and censuses
References
- 1. United Nations Population Fund. https://www.unfpa.org/data/world-population-dashboard Custom search: Population 2018 in Cambodia, Lao People’s Democratic Republic, Myanmar, Thailand, Viet Nam. Accessed March 25, 2019
- 2. Ibid
- 3. World Bank. “Population, total.” Accessed 14 April 2016. http://data.worldbank.org/indicator/SP.POP.GROW
- 4. United Nations, Department of Economic and Social Affairs, Population Division (2015). World Population Prospects: The 2015 Revision. Custom search: Average annual rate of population change (percentage); South-Eastern Asia; 2015-2050.
- 5. United Nations Population Fund, op cit.
- 6. Internet Society. “Global Internet Penetration.” Accessed 7 June 2015. http://www.internetsociety.org/map/global-internet-report/?gclid=Cj0KEQjwy7qrBRC4lp7_hM3dgIoBEiQA72pCnu06-ayCaYoDfCdT8mJnR9tK7pUCA8OPwtIHNOk34-QaAnyH8P8HAQ#global-internet-penetration.
- 7. United Nations Population Fund op cit.
- 8. World Bank. http://data.worldbank.org/indicator/SP.DYN.LE00.IN accessed 16 May 2017.
- 9. World Bank. http://data.worldbank.org/indicator/EN.POP.DNST accessed 16 May 2017
- 10. World Bank. 2006. Labor migration in the Greater Mekong Sub-region, Synthesis Report, Phase 1. World Bank. Accessed 15 June 2015. http://siteresources.worldbank.org/INTTHAILAND/Resources/333200-1089943634036/475256-1151398858396/LM_in_GMSs_Nov06.pdf.
- 11. Sugiyarto, Guntur and Dovelyn Rannveig Agunias. 2014. “A ‘Freer’ Flow of Skilled Labour Within ASEAN: Aspirations, Opportunities and Challenges in 2015 and Beyond.” Bangkok and Washington D.C.: IOM and Migration Policy Institute. Accessed 15 June 2015. http://publications.iom.int/bookstore/free/MPI_Issue11_2Dec2014.pdf.
- 12. Samranjit, Pongtip, ed. Land Grabbing and Impacts to Small Scale Farmers in Southeast Asia Sub-Region. Thailand: Local Act Thailand. Accessed 15 June 2015. http://www.iss.nl/fileadmin/ASSETS/iss/Research_and_projects/Research_networks/LDPI/CMCP_60-Samranjit.pdf.
- 13. ADB and IOM. 2013. Facilitating Safe Labor Migration in the Greater Mekong Subregion. Philippines: ADB. Accessed 15 June 2015. http://www.adb.org/sites/default/files/publication/30210/facilitating-safe-labor-migration-gms.pdf. The authors note further that: “The extended family structure in Southeast Asia makes this migration a household phenomenon, and remittances sent by internal migrants strongly contribute to the household economy, even if the lack of data makes it difficult to quantify the effect and value of such remittances” (p. 11).
- 14. World Bank http://data.worldbank.org/indicator/SP.URB.GROW?locations=KH-LA-MM-TH-VN accessed 27 January 2019
- 15. World Bank 2017. http://data.worldbank.org/indicator/SP.RUR.TOTL.ZS?end=2015&locations=KH-LA-MM-TH-VN&start=2000 Accessed 11 May 2017.
- 16. Hartmann, John. “Outline: Spoken and Written Languages of Southeast Asia.” Accessed 15 June 2015. http://www.seasite.niu.edu/crossroads/hartmann/hartmann.htm.
- 17. Online Archive of California. “The Ethnic Chinese Communities in Southeast Asia.” Accessed 15 June 2015. http://www.oac.cdlib.org/view?docId=hb138nb08w&doc.view=frames&chunk.id=ss1.01&toc.id=ss1.02&brand=oac4.
- 18. Pew Research Center. “Table: Religious Diversity Index Scores by Country.” Accessed 15 June 2015. http://www.pewforum.org/2014/04/04/religious-diversity-index-scores-by-country/.

